Sound representation
The study of sound has given rise to various models, each with a particular focus.
Sound representation models
Temporal representation
This representation shows the evolution of sound intensity over time.
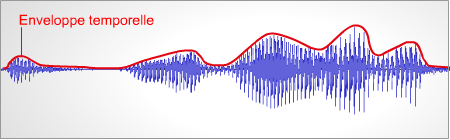
The blue trace shows the evolution of sound intensity of speech over time. This temporal representation allows the visualization of the temporal envelope (in red), which plays an important role in speech perception.
Frequency or ‘spectral’ representation
This mode shows the frequency composition of a sound, but also the intensity at each frequency component.
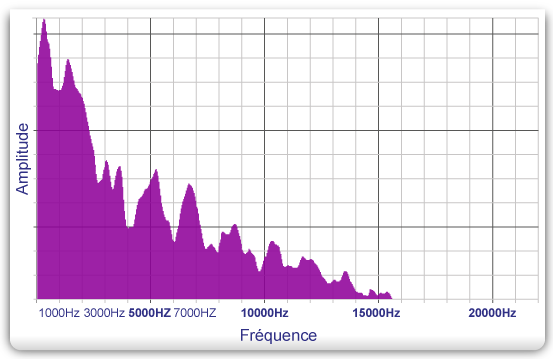
This graph shows the spectral composition of the sound sample used above. This sound contains frequencies from 80 Hz to 15500 Hz.
Three-dimensional representation: the spectrogram
The spectrogram is a representation of a sound’s power at each frequency over time and is very common in speech studies.
This example clearly shows the evolution of frequency over time, which is indicated by the colour: ‘hotter’ colours indicate higher intensities. Vowels and formant transitions are clearly apparent (highlighted by black lines). This representation is of particular interest as it emphasizes movements (black lines), which have a key role in speech perception.
Some common sounds
Voice

Spectrum of the French spoken word « cochlée ». The energy content will vary for each syllable. Each vowel will have three or four peaks of energy, called formant, located at specific frequencies.

White noise

Spectrum of a white noise filtered between 500-6500 Hz. Note that the spectrum is continuous without any specific individual component.

Music

Spectrum of a musical note with a fundamental frequency of 880 Hz (A5). The sound is composed of 7 harmonics, with frequencies that are integer multiple of the fundamental frequency. Note that each component shows a bandwidth larger that expected due to measurement methods.

Pure tone

Spectrum of a pure tone at 440 Hz extracted with spectrum analyzer. Note that each component shows a bandwidth larger that expected due to measurement methods.

The Bel scale
The weakest intensity that the human ear can detect is, on average, from 10-12 W/m2, with the largest around 1 W/m2, or a ratio of one trillion between the two. This scale is difficult to use and has therefore been converted to Bels. These are based on a relative-evolution logarithmic system, or the ratio between two sizes of the same type.
For example, to determine the acoustic intensity level, the reference value is the lowest intensity detectable to the human ear (I = 10-12 W/m2). The level that corresponds to I1 = 1 W/m2, is calculated by the logarithm of the ratio between I1 and I : Intensity level = log10(I1/I ) = log10(1012) = 12 bels.
By adding a multiplying factor of 10, a decibel (dB) scale is obtained, which corresponds to that of loudness (the subjective sensation of sound intensity). Therefore, an intensity of 1 W/m2 corresponds to an acoustic intensity level of 120 decibels.
LI = 10 x log10(I1/I ). If the acoustic intensity is doubled, the sound level is multiplied by 2 (an increase of +3 dB).
When determining sound pressure level, the decibel unit is often followed by the letters ‘SPL’, which characterize the reference sound pressure p0 = 20 x 10-6 Pa = 20 mPa (this is the minimum sound pressure that the human ear is sensitive to).
As stated above, sound intensity is proportional to the square of sound pressure p. Therefore, the level of sound pressure is defined by the following relation: LSPL 20 x log10(p/p0). If sound pressure is doubled, sound level is multiplied by 4 (an increase of +6 dB).
Hearing thresholds are expressed in decibels of hearing loss, dB HL. This scale takes into account the ear’s different sensitivities to different sound frequencies. For example, a normal-hearing person can detect at 500 dB sound from 10 dB SPL, a 2000Hz sound from 0 dB SPL and a 8000Hz sound from 20dB SPL. For audiological purposes, these hearing thresholds at different frequencies are set to 0dB HL. An audiogram allows the representation of hearing thresholds compared to a reference determined from a large normal-hearing population. This scale therefore allows the classification of different degrees of hearing loss (see ‘Tonal audiometry’).